
Chart Echo
Chart Echo searches historical market data to find past chart patterns matching your current setup and shows how they played out before.
Visit
About Chart Echo
Chart Echo is a historical pattern matching tool designed for traders and investors who want to study market precedent before making decisions. The product searches across approximately 450 million historical windows spanning stocks and cryptocurrencies to find chart patterns that closely resemble the setup you are currently watching. Once matches are found, Chart Echo overlays those historical patterns in gold on your current chart and reveals how each match continued after the matching point. This provides an aggregated, data-grounded picture of outcome probabilities, including how often similar setups rose, fell, or went nowhere, the average move, and the typical drawdown along the way. Chart Echo is built for active traders who want to validate setups with real data, long-term investors who need to sanity-check breakouts or sell-offs against decades of precedent, and crypto watchers who recognize that cryptocurrency markets often repeat structural patterns. The tool is free to start with no account required, and it offers a guided, five-step workflow that takes users from selecting a market to saving workspaces and sharing results. Chart Echo is not a prediction engine or financial advice; it is a research tool that organizes the market's own memory so users can study precedent in seconds instead of manually scrolling through years of historical charts.
Features of Chart Echo
450 Million Historical Window Search
Chart Echo searches approximately 450 million historical windows across stocks and cryptocurrencies to find patterns that match your current chart setup. This massive database covers decades of market data, allowing the tool to surface the most relevant analogs regardless of time period or asset class. Each match is ranked by how closely it rhymes with your pattern and how strongly the similarity holds, giving you a clear view of the most statistically significant precedents.
Gold Overlay Visualization
When a historical match is found, Chart Echo overlays that past pattern directly onto your current chart in gold. This visual comparison lets you see exactly how the historical structure aligned with your setup, making it easy to assess the quality of the match at a glance. The overlay preserves the original shape and scale, so you can intuitively judge whether the past pattern truly mirrors your current situation.
Outcome Statistics Dashboard
For each matched pattern, Chart Echo computes and displays detailed outcome statistics showing what happened after the match point. You can see the average move, the typical drawdown, the percentage of times the setup rose versus fell, and the range of outcomes over various time horizons. This data is aggregated from all matched patterns, giving you an honest, probabilistic view of potential future scenarios rather than a single prediction.
Guided Five-Step Workflow
Chart Echo provides a structured, guided path from start to finish, eliminating guesswork and blank canvases. The workflow moves through five clear steps: selecting the market, framing the pattern with timeframe and candle count, reviewing ranked matches, overlaying and analyzing an echo, and finally acting by saving, setting reminders, or sharing results. This streamlined process ensures users can quickly go from observation to actionable insight.
Use Cases of Chart Echo
Pre-Trade Setup Validation
Active traders can use Chart Echo to validate potential trade setups before committing capital. By finding historical patterns that closely match the current chart, traders can study how similar setups resolved over the following days and weeks. This provides concrete data on win rates, average profit targets, and typical stop-loss levels, helping traders make more informed entries and exits based on market precedent rather than intuition alone.
Long-Term Investment Sanity Check
Long-term investors can leverage Chart Echo to sanity-check major market events such as breakouts, sell-offs, or consolidation phases. Instead of relying on a single analyst's opinion, investors can see how similar patterns played out across decades of market history. This historical context helps frame whether a current move is statistically unusual or well within normal market behavior, supporting more disciplined long-term decision-making.
Cryptocurrency Pattern Analysis
Crypto watchers can use Chart Echo to match Bitcoin, Ethereum, and other major cryptocurrencies against their own past structures and across different assets. Cryptocurrency markets are known for repeating structural patterns, and Chart Echo's extensive crypto database allows users to identify when today's chart has occurred before. This is particularly useful for spotting potential breakout or reversal zones based on historical precedent in the crypto space.
Educational Chart Study
Traders and students of market behavior can use Chart Echo as an educational tool to understand how patterns resolve over time. By exploring hundreds of historical matches for any given setup, users can develop a deeper intuition for market mechanics, pattern reliability, and the range of possible outcomes. This hands-on learning approach helps build pattern recognition skills without requiring years of manual chart review.
Frequently Asked Questions
What exactly does Chart Echo do?
Chart Echo searches a database of approximately 450 million historical chart windows across stocks and cryptocurrencies to find patterns that closely resemble the chart you are currently viewing. It then overlays those historical matches on your chart and shows you how each match performed after the matching point, including average moves, drawdowns, and probability of rising or falling. It is a research tool for studying market precedent, not a prediction engine.
Is Chart Echo free to use?
Yes, Chart Echo is free to start with no account required. You can search for matches and view results immediately. Creating an account unlocks saved workspaces for revisiting your analyses. A Premium tier adds Pro Mode features such as intraday timeframes, saved-setup reminders, alerts, and watermark-free exports for users who need advanced functionality.
Does Chart Echo work for both stocks and crypto?
Yes, Chart Echo covers both stock and cryptocurrency markets. The tool searches across a broad universe of assets, including major stocks, indices, and popular cryptocurrencies like Bitcoin and Ethereum. Users can select from a searchable list or tap popular starting points to begin their analysis.
Is Chart Echo financial advice?
No, Chart Echo is not financial advice and does not make predictions. It is a historical research tool that organizes market data so users can study how similar chart patterns have played out in the past. All outcome statistics are based on historical precedent and should not be interpreted as guarantees of future performance. Users should always conduct their own analysis and consult with qualified financial professionals before making investment decisions.
Pricing of Chart Echo
Chart Echo offers a free tier that requires no account and provides full access to historical pattern matching and outcome statistics. Creating a free account enables saved workspaces for revisiting analyses. A Premium subscription is available for users who need advanced features including Pro Mode, intraday timeframes, saved-setup reminders, alerts, and watermark-free exports. Specific pricing details for the Premium tier are not provided in the available context.
Similar to Chart Echo

Polymarket Trading Bot For Crypto
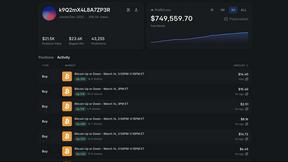
This Polymarket bot automates a proven high-frequency arbitrage and directional trading strategy on 5-15 minute crypto markets.